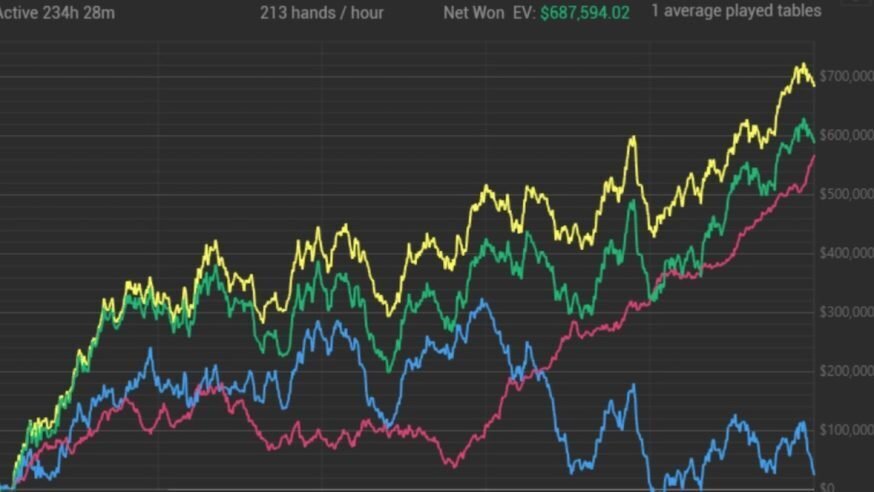
Modern poker is increasingly a game of measurement. Human memory over-weights unusual hands, painful losses, big pots and last night's session. It quietly ignores the routine decisions that, repeated tens of thousands of times, decide whether you win or lose.
Database analysis is the alternative. Tracking software turns every hand you play into structured evidence. Instead of asking whether one bluff was right, you can ask whether an entire category of bluffs makes money. Instead of wondering whether you play the blinds badly, you can measure it.
Turning results into evidence
Tracking tools record position, stack depth, hole cards, every action and the statistics that summarise them. Volume is useful, but the real advantage is classification. You can split situations apart and isolate one variable at a time.
A vague worry like "I lose too much with top pair" becomes a set of testable questions. Single-raised pots or three-bet pots? In position or out? Deep or short? Each filter narrows the problem until it is small enough to fix.
Start big, then zoom in
The most common mistake is starting with individual hands or your biggest losing pots. Those usually show you variance, not leaks.
Begin at the macro level. Win rate by position comes first, because the blinds and the button tell you most of what you need to know about your pre-flop structure. Then segment: by pot type, by stack depth, by opponent type.
Pre-flop statistics like VPIP, PFR, three-bet percentage and blind defence reveal structural tendencies. Post-flop numbers such as continuation-bet frequency and aggression by street add the next layer. No single statistic defines good poker. A 25% three-bet frequency might be brilliant against one field and suicidal against another. Context decides.
Use filters to find specific leaks
Filtering is the core of the method. A 100,000-hand database contains thousands of strategically different situations. Filtering reduces that complexity to something you can study while keeping enough hands to mean something.
The most productive filters follow lines rather than single actions. "Raised pre-flop, continuation-bet flop, checked turn, faced a river bet" is a line. If that line loses money consistently, you have found a pattern worth real study time rather than a one-off.
Compare with theory, without becoming a solver slave
Databases and solvers answer different questions. A solver tells you what an equilibrium strategy looks like. A database tells you what actually happened against real opponents. Used together they are powerful; used alone each misleads.
The ordering principle for study is deviation multiplied by frequency. A slightly wrong decision that occurs thousands of times costs more than a badly wrong decision in a spot you see twice a year. Database analysis stops you spending weeks on intellectually fascinating situations that have no practical impact on your results.
Sample size, variance and bias
Databases can create false confidence. Winning players have long losing stretches, and individual categories swing even harder than overall results.
With limited samples, study frequencies rather than money. How often you fold to a river bet is reliable far sooner than how much you win when you call one.
Three biases to watch for:
- Selection bias: reviewing only losing hands.
- Outcome bias: judging a decision by its result.
- Survivorship bias: copying successful players without seeing the ones who played the same way and failed.
Before acting on any finding, ask four questions. Is the sample big enough? Does the filter measure what I think it measures? Is a negative result expected in theory? Could variance plausibly explain this?
Build a continuous cycle
The value of a database comes from using it continuously, not from an emergency review after a bad night. A productive loop looks like this:
- Observe broad performance indicators.
- Hypothesise a specific weakness.
- Filter to isolate the relevant situations.
- Analyse frequencies before money.
- Implement one clearly defined change.
- Measure whether behaviour actually changed after more volume.
Step six is where most players stop. Changing a strategy and checking that the change happened are different things, and only the database can confirm the second.
Why this produces a long-term edge
Database analysis moves you from stories to statistics. A bad session becomes less important than a recurring positional weakness. A memorable hero call matters less than your overall river calling efficiency.
The strongest players build systems in which profitable decisions happen often and costly mistakes happen rarely. The database shows where money is lost, which situations deserve study, whether changes have taken hold, and which low-frequency spots are not worth your time.
The goal is not perfect numbers. It is understanding why the numbers look the way they do. Every statistic should connect to a range, every range to an assumption, and every assumption should be tested against results. Over hundreds of thousands of hands, that discipline compounds into a real and measurable edge.